
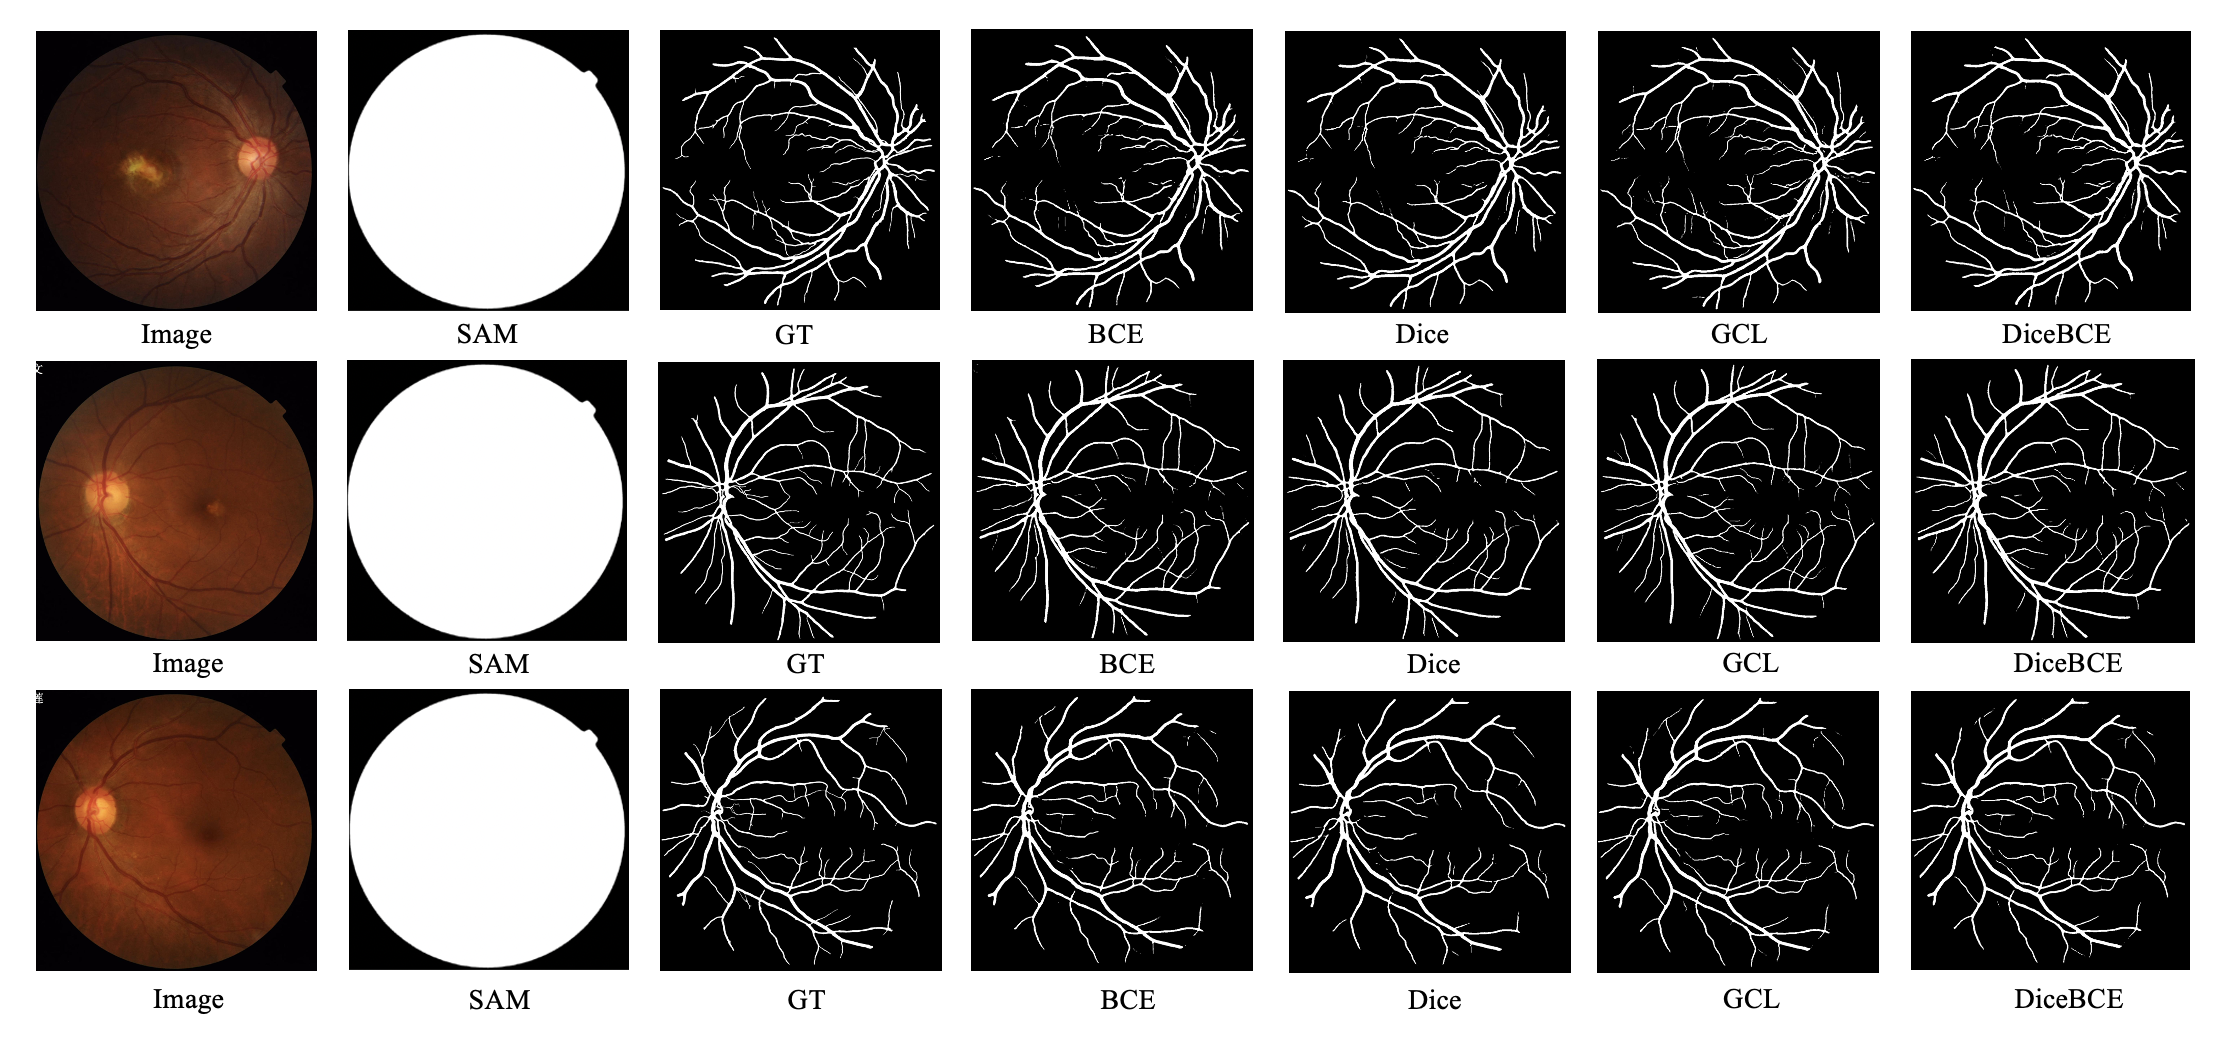
Fine-tuning SAM for Vessel Segmentation through Loss Function Adjustments
Fine-tuning Segment Anything Model through Loss Function Adjustments.
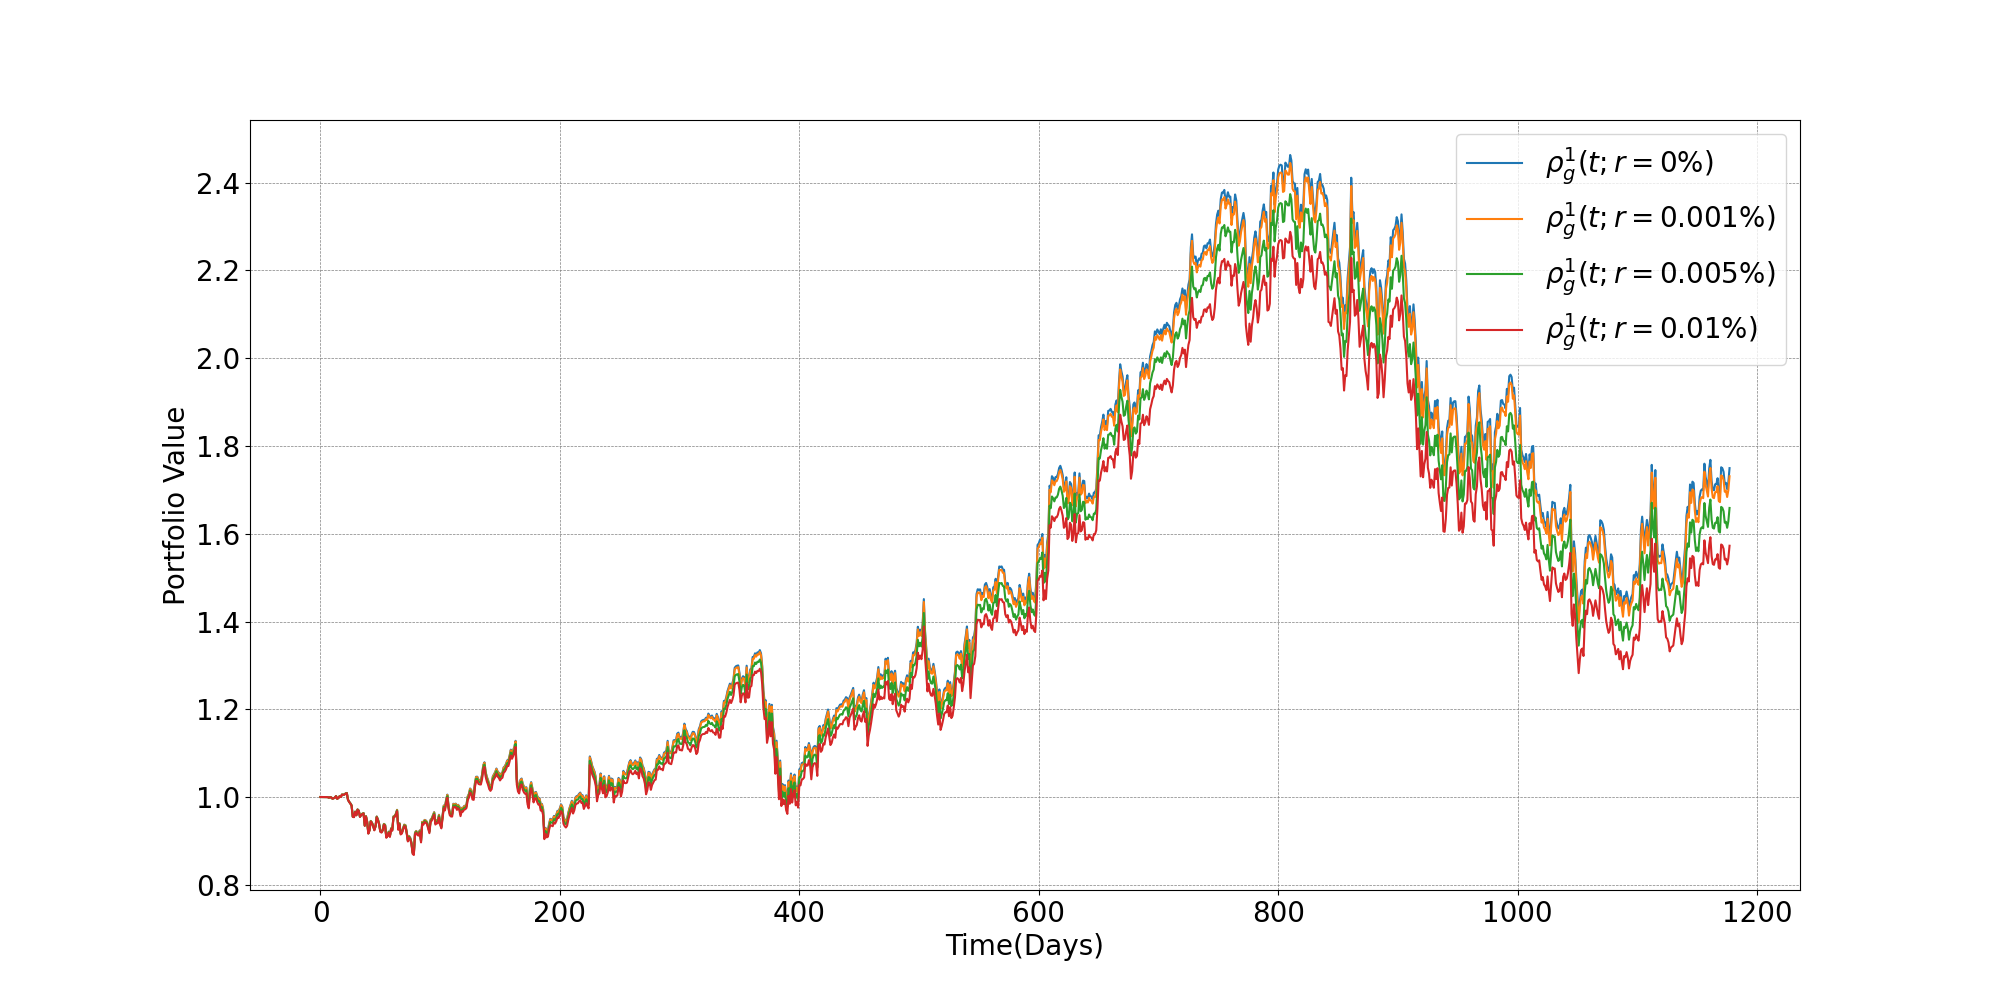
Portfolio Management Using Prediction Rules and Communication in Social Networks
In this study, we conduct a comprehensive analysis of Google stock (GOOGL) daily returns using the Yahoo Finance dataset. The dataset is preprocessed and partitioned into past and future segments in a 3:1 ratio, with various statistical methods applied, such as daily return calculations, autocorrelation function (ACF), partial autocorrelation function (PACF), and Dickey-Fuller stationarity testing. By constructing two Bayes detectors based on Logistic and Gaussian distributions and incorporating association rules, we develop investment strategies aimed at limiting trading frequency and reducing transaction costs. We assess the effectiveness of these strategies through simulation, taking into account factors such as risk-free interest, greed, efficient frontier, and adaptive greed. Overall, this study offers valuable insights into the daily returns of GOOGL and the potential for implementing profitable investment strategies.
Five in a Row
The game is played on a hexagonal board instead of a square board. Two players alternately put their “stones” at any empty position of the board. The black player puts first. A player wins once he forms a chain of exactly five stones along the lines of the board. If no ones win when the board is full of stones, it is a draw.


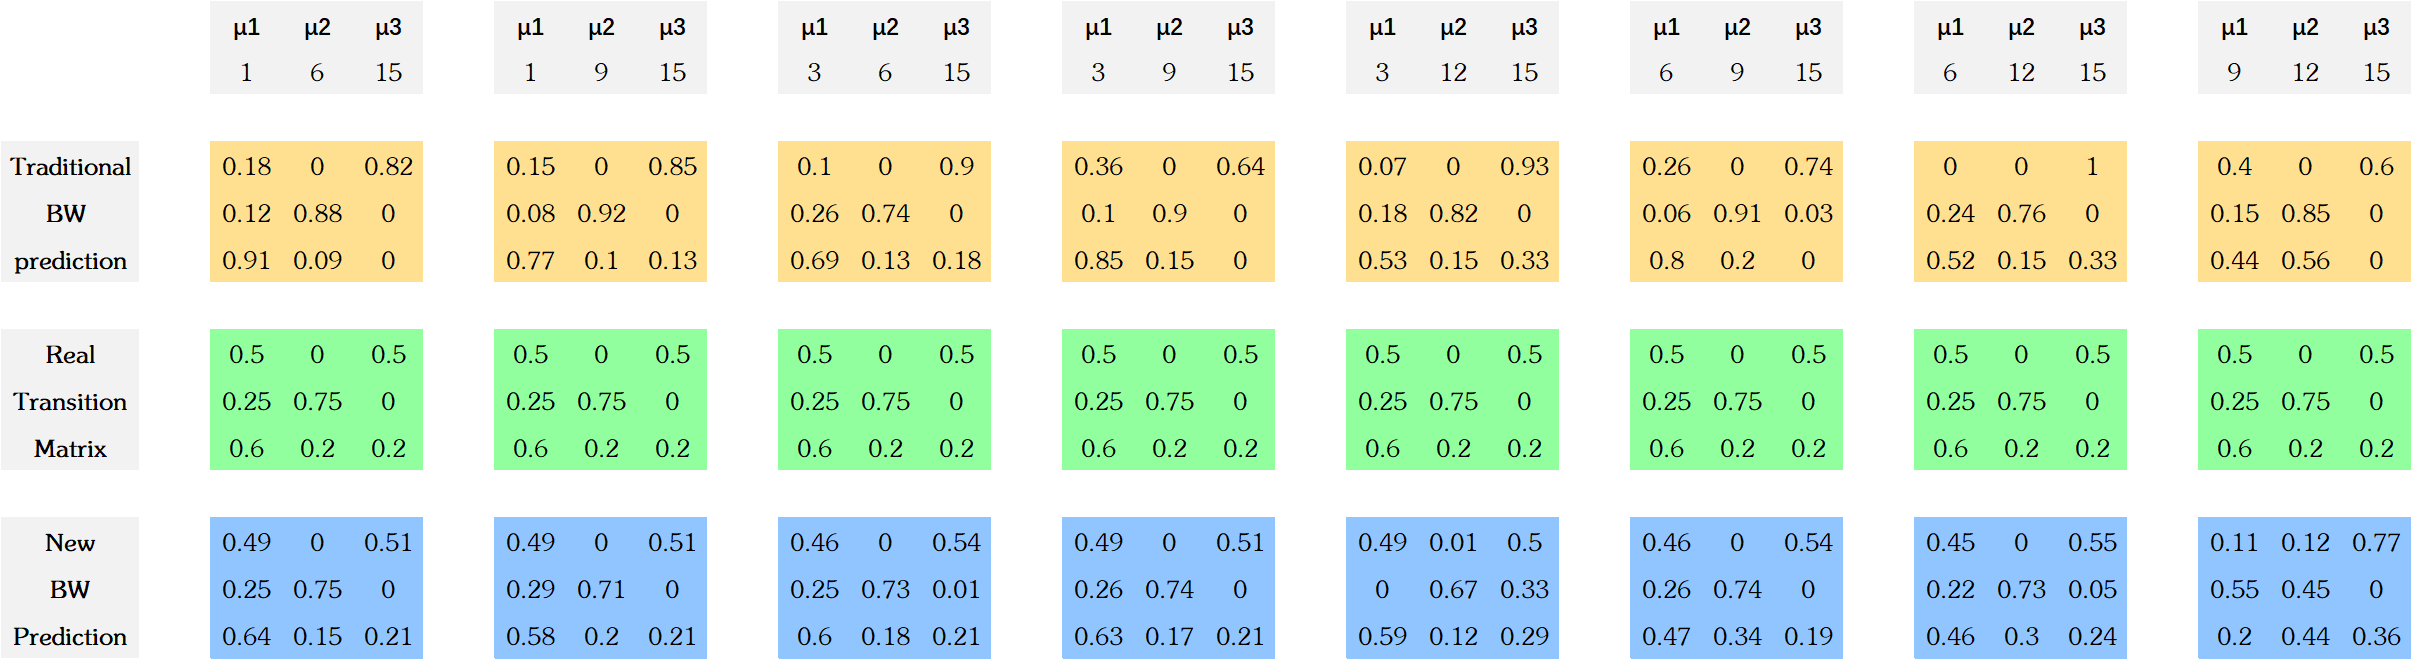
An Improvement in Baum Welch Algorithm - A Case Study of HSI future
The Baum Welch Algorithm is widely used for training the parameters of Hidden Markov Models using EM techniques. However, the traditional BW algorithm doesn’t make any distributional assumption for the observations. In this paper, we propose a Distribution Based BW algorithm and study its advantages by experiments of simulated HMM chains. We also apply this new BW algorithm on HSI futures study. The new proposed Distribution Based BW algorithm can improve the performance significantly both in experiments and real-world practice.
Herding model
Herd behavior, in which many investors adopt the same trading strategy or have the same preferences for a particular asset over a certain period, is a good explanation of “bounded rationality” in the real world. This project sets out over 80 rules containing three types of investors and three types of market news to simulate herd behavior in the real-world stock market. Based on the comparison of stock price, returns time series and investor behavior chart per round, we find that Herd Behavior will begin to highlight in the period of stock price acute fluctuations. A direct comparison is made with the daily closures of the Hang Seng index. Our stock sequences exhibit properties like actual market data.
Association Rules and Prediction Rules for Financial Data Mining
We analyzed two stocks, AAPL and AMD, using data sourced from Yahoo Finance. Daily returns were computed for both stocks. For AAPL, the report examined the w-day Exponential Moving Average (EMA), Cumulative Distribution Function (CDF), and Probability Density Function (PDF). Mean-Variance Analysis was then applied to both AAPL and AMD to determine the optimal portfolio. Additionally, the study focused on association rules, with emphasis on four metrics: confidence, geometric mean, arithmetic mean, and rule power factor. The report concluded that geometric mean and rule power factor are better suited to assess association rule quality, as they consider both rule frequency and accuracy.
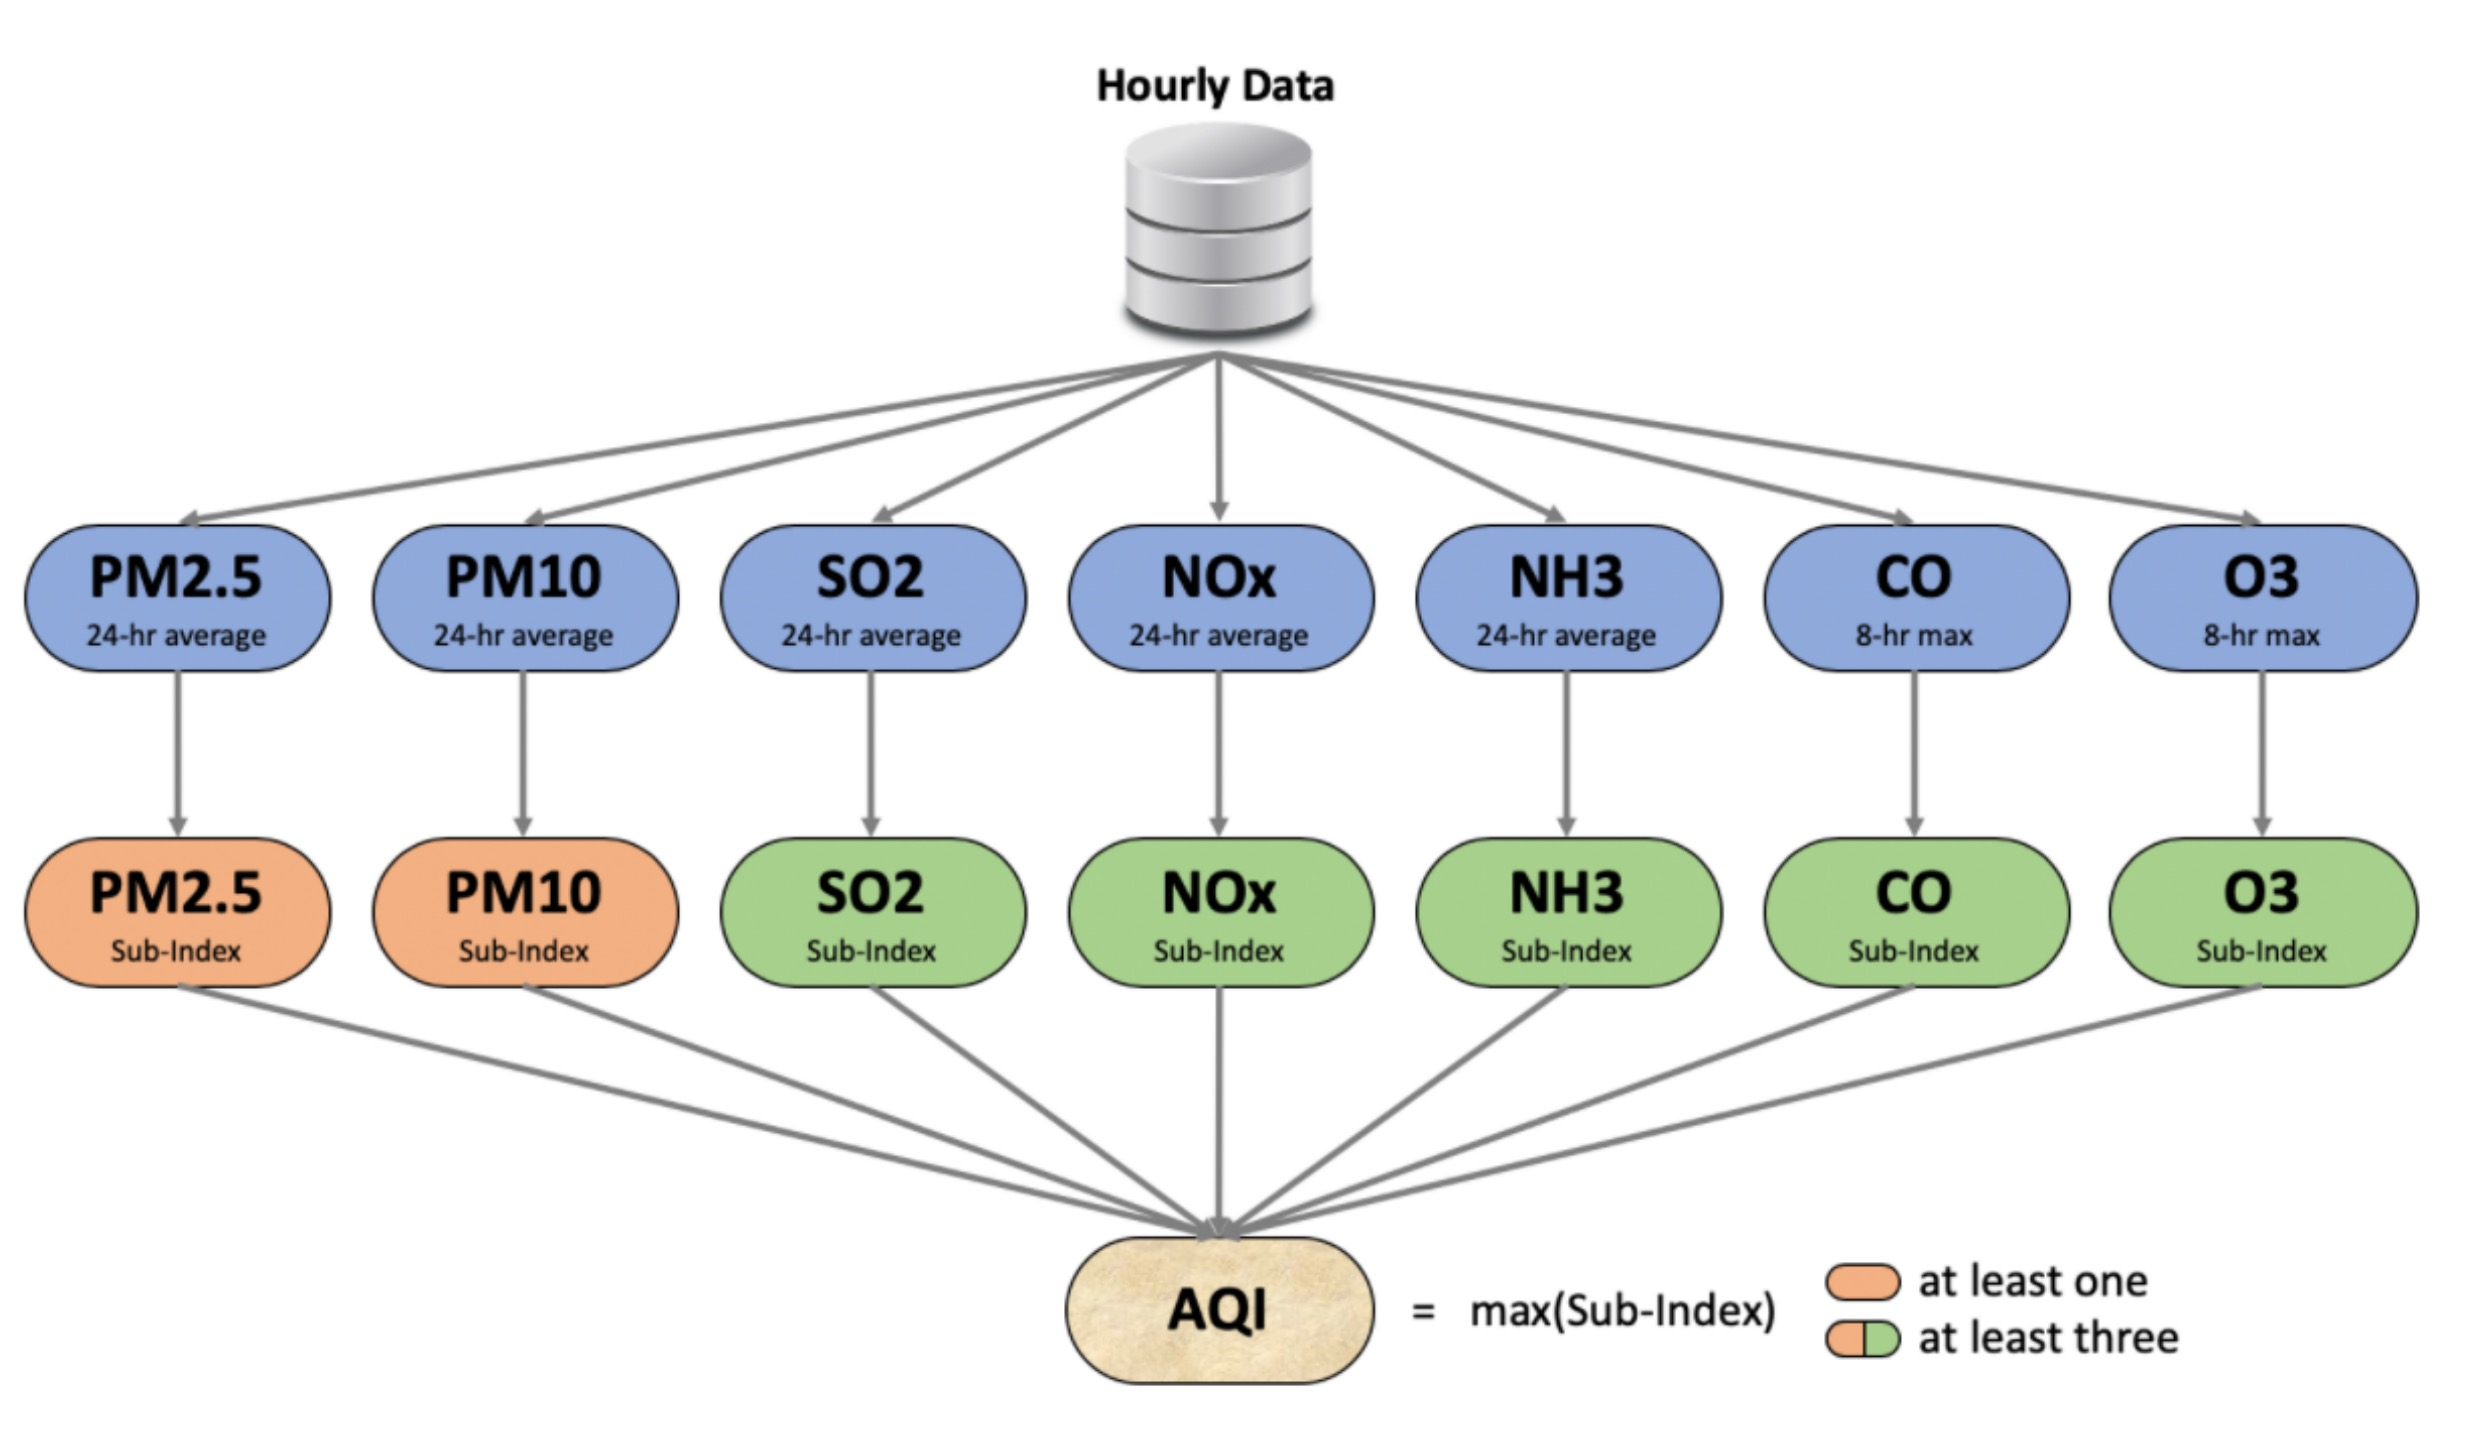
Predicting Air Quality In India Based On Time Series Model
Air pollution poses a significant threat to human health. To address its negative impact, it is essential to quantify and predict air pollution levels and implement appropriate policies and measures. Since the AQI index serves as a measure for air pollution, this article aims to predict AQI using Time Series Models. Initially, we built a SARIMA model to train and predict Indian AQI. Subsequently, we developed an Intervention Model to modify the SARIMA model to account for the significant impact of COVID-19. Our experiments demonstrate that the Intervention Model leads to a substantial improvement in prediction accuracy, making the combination of the Intervention Model and the original SARIMA Model highly desirable. The MAPE for the Intervention Model was 26%.
Multi-factor Stock Selection Strategy With Different Models
In our study, we aimed to address the limitations of traditional stock modeling techniques by incorporating a larger number of explanatory variables and utilizing a range of advanced modeling techniques, including Logistic Regression, Random Forest, SVM, LSTM, and ensemble methods such as voting and boosting. Our comprehensive set of quantitative trading models was evaluated using several performance indicators, such as Annual Return, Sharpe Ratio, Maximum Drawdown, and Win Rate. Our results indicate that Random Forest performed the best among the single-model trading approaches, while the multi-model combination based on Logistic Regression + Gradient Boost achieved the highest Annual Return and Win Rate. Moreover, the trading model based on Logistic Regression + Gradient Boost + Random Forest had the highest Sharpe Ratio and Maximum Drawdown. Our findings suggest that incorporating a larger number of factors and utilizing advanced modeling techniques can significantly improve the performance of quantitative trading models.